What's in a (last) name? Digging into the DBLP
A few days ago I happened to read this conversation on twitter:
@iabello or the person who had all the ideas? In #math we use alphabetical order -> less problems @PhD_Connect
— Marco Lübbecke (@mluebbecke) June 14, 2015The discussion on how contributions should be properly acknowledged is almost as old as mankind. I thought of taking a look at the data™ to see what’s going on, who uses the alphabetical order and who doesn’t: so there goes my sunday evening.
Collecting the data
DBLP is a website that lists publications on computer science topics – in a rather broad sense. They release a dump of their whole database almost every day. The database contains entries for roughly 3 million publications (~1.6 GB): a nice size, large enough to be interesting, but still small enough to be handled without troubles on any laptop.
The most recent xml dump can be downloaded from here. Parsing an xml file is not exactly my definition of fun; fortunately, the maintainers of DBLP provide a couple of handy Java classes that I could easily adapt to my need. I decided to extract only the entries with the tag “article”, that should correspond to full-length journal papers. The resulting csv file (~300MB) can be easily loaded into memory and explored using nice Python tools such as Pandas and matplotlib.
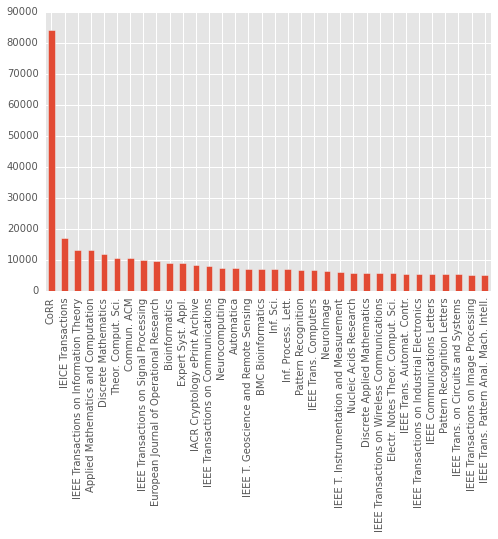
The total number of articles is around 1.3 millions, and around 1500 journals are represented in the DBLP. The “journal” with (by far) most articles is CoRR… which is not actually a journal, but the Computing Research Repository of the arXiv, that hosts non-peer-reviewed preprints. The following plot shows the journals with at least 5000 entries. A lot of them are IEEE journals.
Last names and authorship
Let’s take a look at the author names, as promised. First of all, a bit of work is required to extract the last name of each author, since DBLP stores the full name as a string. This is not really a trivial task, but a couple of regular expressions and the nameparser library are sufficient to do the job.
At this point it’s easy to check if the authors of an article are in alphabetical order or not. My first idea was that, in a vacuum, the fraction of alphabetically-ordered articles in a journal should be somehow correlated with the average number of authors per publication. After all, the more authors you have, the hardest it is to have an alphabetical order by pure chance. If all the permutations of the n authors were equally likely to occur, the alphabetically-ordered permutation would have a probability \(\frac{1}{n!}\) to occur.
So here is a scatter plot of the journals according to the fraction of alphabetically-ordered articles and the average number of authors per paper. I also plotted the \(\frac{1}{n!}\) line, in red. The area of the points is proportional to the number of articles published by the journal. An interactive version of the plot can be found here (warning: it’s quite heavy, thus not mobile friendly) – you can zoom in/out and hover on a point to read the name of the journal.
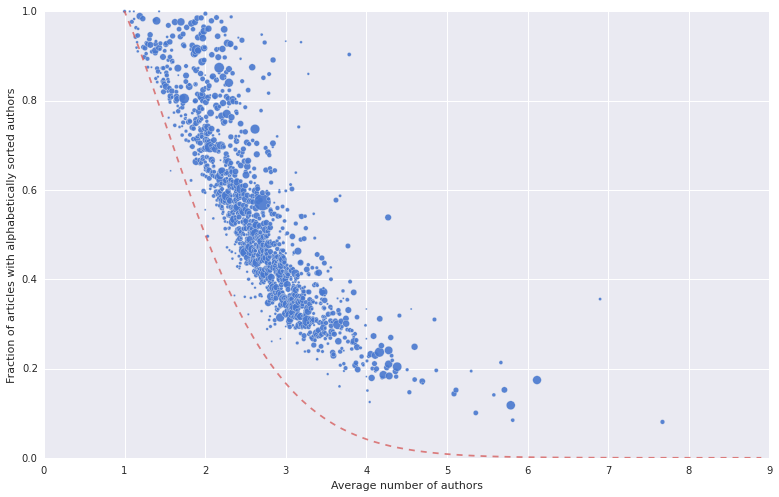
The fraction of papers with authors in alphabetical order (let’s call it \(\alpha\)-index) does decrease as the number of authors per article grows. The aggregated table sorted according to this index looks like this:
| journal | count | \(\alpha\)-index | avg. num. authors |
|---|---|---|---|
| J. London Math. Society | 386 | 0.994819 | 2.002591 |
| Notre Dame Journal of Formal Logic | 2440 | 0.989344 | 1.188934 |
| Discussiones Mathematicae Graph Theory | 802 | 0.986284 | 2.140898 |
| Combinatorics, Probability & Computing | 1033 | 0.985479 | 1.950629 |
| Combinatorica | 1331 | 0.984974 | 1.900826 |
| … | … | … | … |
| Brain Connectivity | 220 | 0.140909 | 5.581818 |
| NeuroImage | 6374 | 0.117666 | 5.791654 |
| Int. J. Computer Assisted Radiology and Surgery | 696 | 0.100575 | 5.357759 |
| BMC Medical Imaging | 261 | 0.084291 | 5.816092 |
| Database | 448 | 0.080357 | 7.674107 |
The last entry (corresponding to the small point on the bottom right) refers to “Database - The Journal of Biological Databases and Curation”. It’s quite evident that the journals at the top of the list have much fewer authors per article. But there’s more to it. Even comparing journals where the average number of authors is similar, the plot shows that some have a significantly larger fraction of articles in alphabetical order, and this probably has to do with the different research communities publishing on the journals.
In an attempt at identifying clusters, I simply filtered the name of the journals – far from a sophisticated or rigorous procedure.
Recalling the tweet I quoted, I first isolated the more mathematically-oriented journals, filtering the titles containing “mathematical” terms: Math|Comb|Logic|Geometr|....
On the other hand, one can observe that a lot of papers with many authors are related to “biological sciences” – I guess that experiments often involve a lot of people.
In this case I used terms such as Bio|Medic|Neuro|Optic|.... Again, this filtering is by no means accurate1, but it’s good enough for my purpose: a nice plot where I have highlighted (in dark) the “mathy” journals and (in red) the “bio” journals.
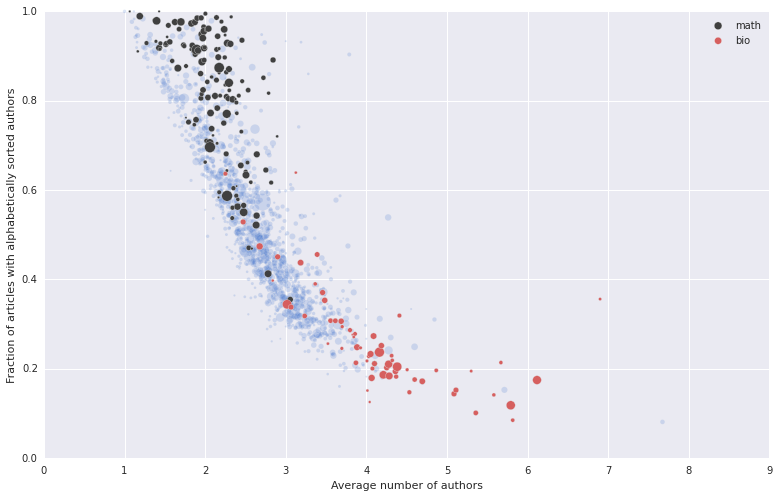
Indeed, it looks like most journals heavy on the theoretical/mathematical side are ahead in the noble quest of ordering all the authors’ names alphabetically. Viceversa, journals with research on biological/medical topics have a low \(\alpha\)-index and a lot of authors: I suspect they have a set of byzantine rules and conventions to rank the authors of a publication. In my quick and dirty exploration I haven’t found other clusters which are identified this easily. The middle of the pack contains CoRR (not surprisingly, as it contains a huge number of articles from quite different communities), and most IEEE/engineering journals.
First authors
In some research communities, being the first author has a quite special meaning, and having a number of first-author articles is something required career-wise, at least informally. Even in the communities where the alphabetical order is typically used, I still believe that the order of the authors can affect (even if only subliminally) the perceived importance of each author’s contribution: after all, papers are often cited only by their first author. So, for fun, why not take a look at the probability of being first author as a function of the first letter of the surname2.
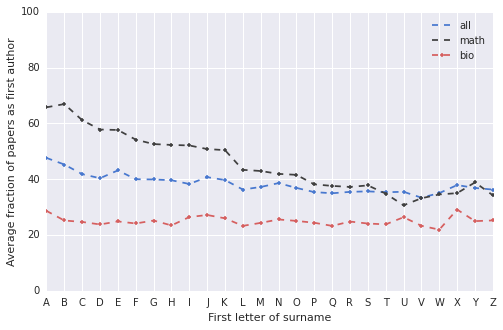
Here’s a plot that tries to quantify how the likelihood of being first author changes as a function of the first letter of the surname. For each author, I computed the fraction of publications where they were listed as first authors, and then I aggregated by letter (obviously I’m not claiming any deep statistical meaning here). The blue line represents the overall distribution of the DBLP articles, that shows a slight advantage for authors with a lower initial. For the journals I have classified as “mathy” (dark line), the first letter of the surname goes a long way to determine who’s first author – not surprising, since in most of the papers the authors’ names are sorted alphabetically. If you do math or theoretical CS and have a surname with ‘B’ as the first letter, you’re going to be first author in almost 70% of your articles, while if your surname begins with the letter ‘U’, you’re out of luck: you’re going to be first author only 30% of the time3. Finally, the line in red corresponds to the journals of the “bio” cluster. The probability of being first author is basically uniform for all surnames – and actually quite low, consistently with the larger number of authors per article.
This is a superficial analysis; I’m sure deep and careful research has been carried out on this and similar issues, possibly on even more comprehensive datasets (it’d be nice to do this for publications in all academic fields.. that would certainly require much more work). Still, it’s fun.
-
Another reason why this filtering can’t be super accurate is that the name of the journals in DBLP are often abbreviated (I have no idea how to classify, for example, a “IJBIDM” – unless I google it). Having the full journal names would already bring an improvement. ↩
-
A quick google search shows that there are a few articles on the impact of last names on career paths. The ones I found look rather weak/unconvincing to me. I’m not sure it’s something real and that can be easily quantified, but since the first letter of my surname is a ‘T’, I can’t deny I’m somewhat sensitive to the issue. ↩
-
Of course this whole argument is a bit silly. By the way, the bias could also be considered in the opposite way: if you’re a ‘U’ and you have a lot of first-author papers, you have clearly “contributed” a lot, but if you’re a ‘B’, well, maybe someone could claim you were just in the right spot, at the right time. ↩